Quick Summary
| Detail | Info |
|---|---|
| Instrument | German 30 Index (GER30 / DAX) |
| Timeframe | Multi-Timeframe — Weekly, Daily, 4H |
| Date | May 17, 2026 |
| Current Price | 23,899.65 |
| Bias | Strongly Bearish |
| Sell Target | ~21,900 (-1,900 points / -8.15%) |
| Key Trigger | Break and close below current Weekly Low |
| Status | ⏳ Waiting for confirmation — setup developing |
What Is the German 30?
Before we get into the analysis, a quick note for traders who primarily trade forex — the German 30 (GER30), also known as the DAX, is Germany's premier stock market index. It tracks the performance of the 30 largest companies listed on the Frankfurt Stock Exchange — including global giants like Volkswagen, Siemens, BMW, SAP, and Deutsche Bank.
The GER30 is one of the most widely traded indices in the world. It is heavily influenced by European economic conditions, ECB policy decisions, and global market sentiment. When global risk appetite falls — as it appears to be doing right now — the GER30 typically leads European markets lower.
This is not just a technical setup. The macro conditions are lining up to support what the charts are showing.
The Big Picture — Weekly Timeframe Analysis
Everything starts at the weekly timeframe. And the weekly chart on GER30 is telling a very clear story right now.
Two weeks ago, the German 30 reached and was rejected from its highest high — a significant all-time or multi-month peak near the 25,199 area. This was not a minor resistance level. This was the absolute ceiling of the market's recent bullish run — a level where the most significant selling pressure in the entire recent history of this index exists.
When price reaches that kind of level and gets rejected, it matters. Institutions and large players who accumulated positions during the rally begin distributing — selling into the strength that retail buyers are still chasing. That rejection is the first major signal that the bullish momentum is exhausted.
Last week confirmed what that rejection started. The weekly candle closed as a clear bearish candlestick — a full red week with price moving decisively downward. This is not a small pullback candle. This is the market printing its first confirmed bearish weekly close after being rejected from peak resistance.
This week, price is currently testing the low of the current week. The fact that we are testing the weekly low mid-week — rather than recovering and building higher — tells us the sellers are still in control. Buyers are not defending this market with conviction.
The weekly picture: rejected from peak resistance → bearish weekly close → testing weekly lows. That is three consecutive signals pointing in the same direction.
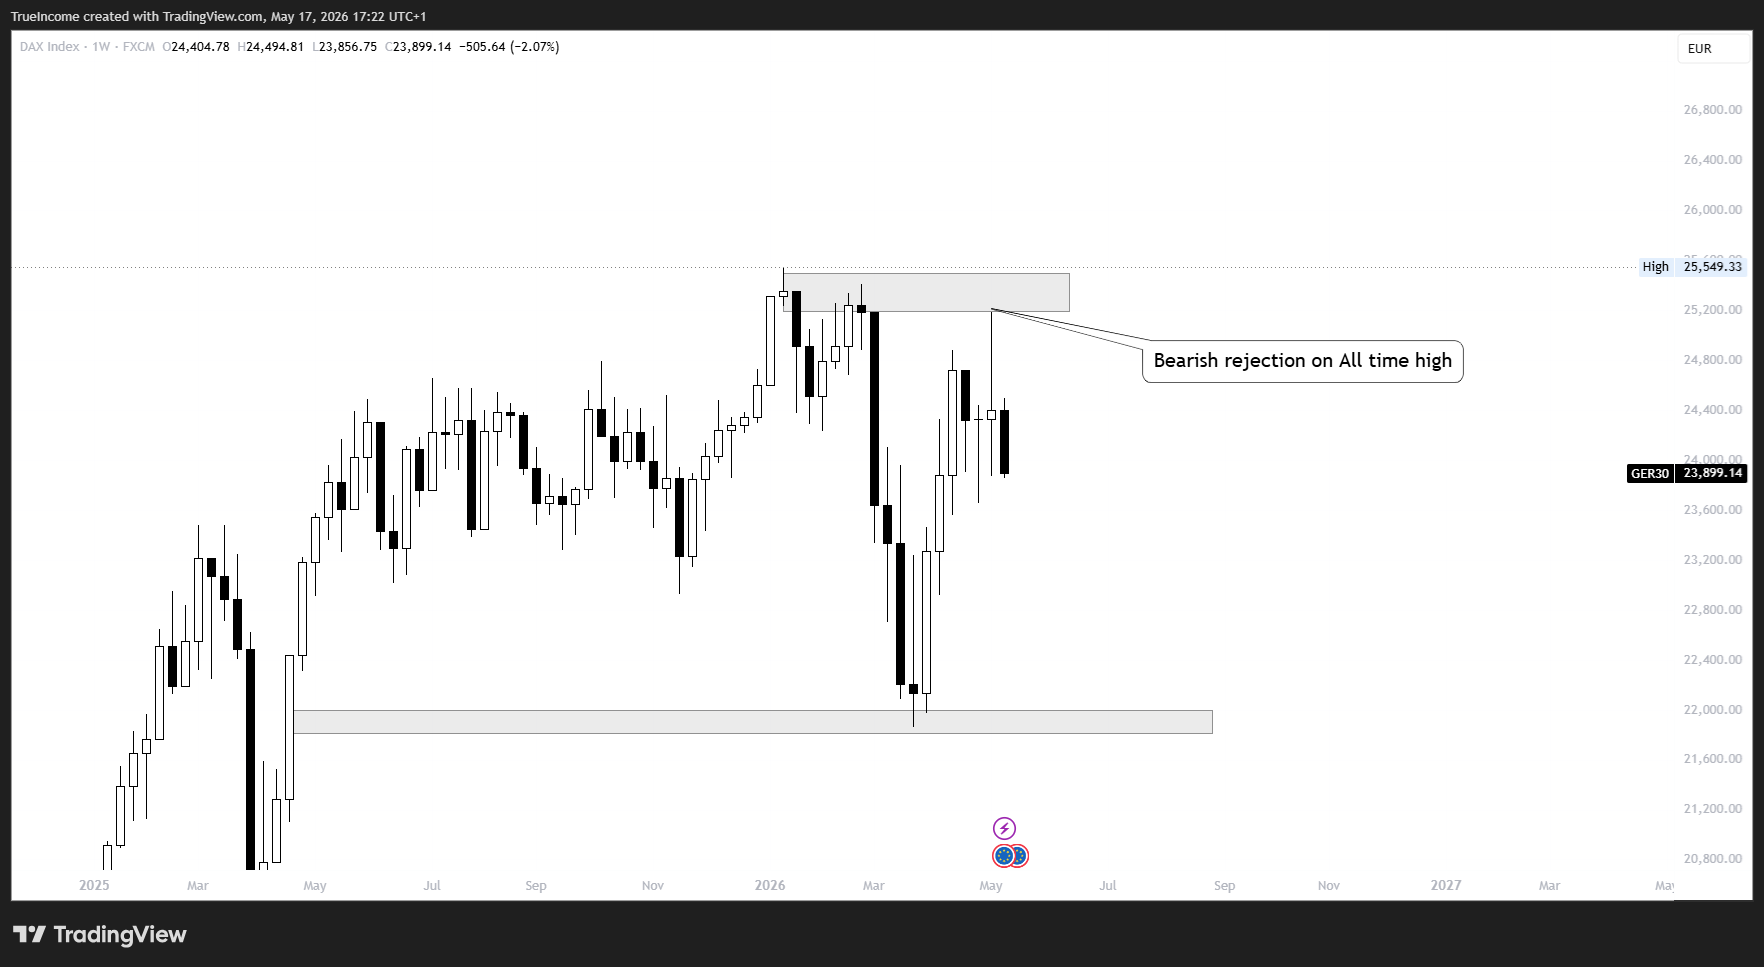
"Major Resistance Rejection | Bearish Weekly Close | Weekly Low Under Pressure"
Daily Timeframe — Reversal Pattern + Divergence Confirm the Bias
Moving down to the daily timeframe, the bearish picture becomes even more compelling — because we now have two additional layers of confirmation.
Reversal Pattern
On the daily chart, price has printed a clear, recognizable reversal pattern at the highs. This is the market showing us — on a smaller, more precise timeframe — exactly where and how sellers stepped in aggressively. A reversal pattern at a significant weekly resistance, confirmed by a bearish weekly close, is one of the most reliable signals available in technical analysis.
This is not coincidence. This is institutional distribution — large players selling into the highs while retail buyers were still excited about the upside.
Divergence
Adding further weight to the bearish case — the daily timeframe is showing divergence. Divergence occurs when price makes a higher high but the momentum indicator fails to confirm it — making a lower high instead. This is one of the most powerful early warning signals of an impending reversal.
What divergence is telling us is that although price pushed to new highs, the underlying momentum behind that move was weakening. The buyers were running out of fuel. And when fuel runs out at a major resistance level — the fall tends to be sharp.
The combination of a reversal pattern AND divergence on the daily timeframe, sitting directly beneath a major weekly rejection zone, gives this sell setup a very high level of technical confluence.
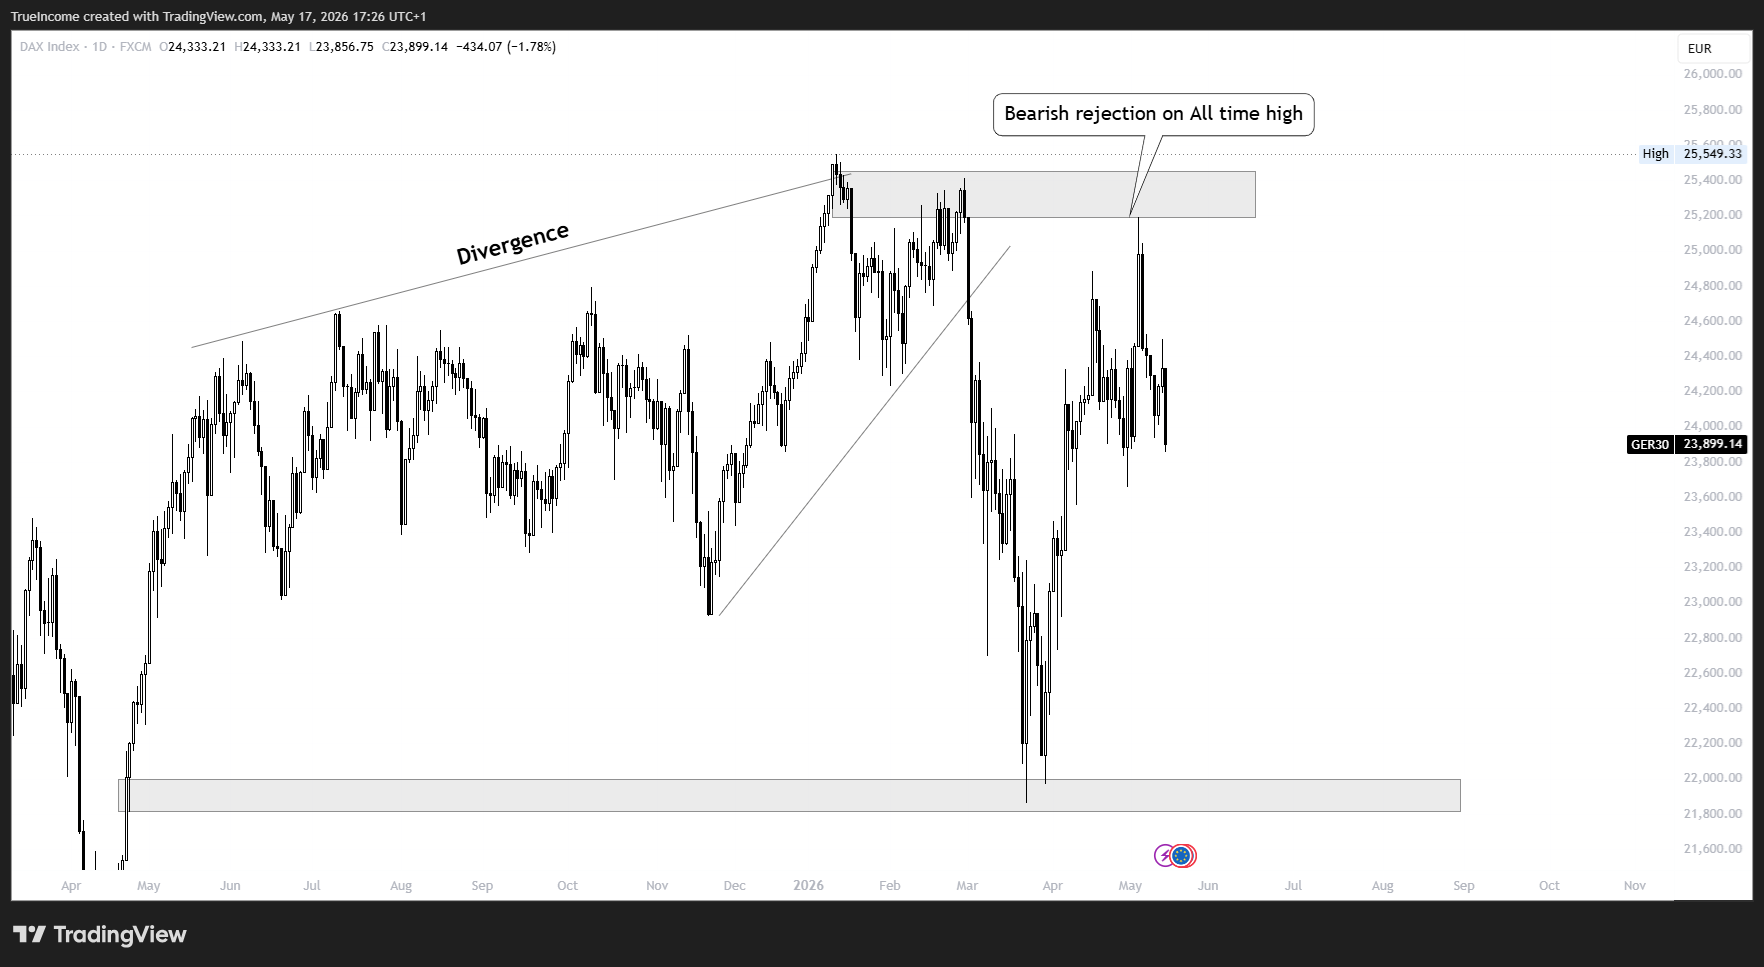
price making higher high while momentum indicator makes lower high. Label: "Daily Reversal Pattern | Divergence Confirmed | Distribution Zone"
4-Hour Timeframe — The Ranging Phase Before the Break
Dropping down to the 4-hour chart — which is our execution timeframe — we can see the result of all the higher timeframe pressure playing out in real time.
After the sharp rejection from the weekly high and the bearish daily signals, the 4-hour chart is currently in a ranging phase. Price is consolidating — moving sideways in a compressed zone — as the market absorbs the selling pressure from the higher timeframes and decides its next move.
This ranging behavior on the 4-hour chart is actually very typical at this stage of a setup. Think of it as the calm before the storm. The weekly and daily timeframes have given their verdict — bearish. The 4-hour market is simply pausing, building energy, before the next directional move unfolds.
Importantly, this range is compressing near the lows of the move — not near the highs. Price is not recovering back to the top of the recent range. It is sitting at the bottom, which tells us the path of least resistance continues to be downward.
Within this 4-hour range, we can also observe a rising wedge / ascending channel pattern — a bearish formation where price makes slightly higher lows within a tightening structure. These patterns typically resolve to the downside, and in this context — given the weekly and daily picture — a downside resolution is precisely what we are anticipating.
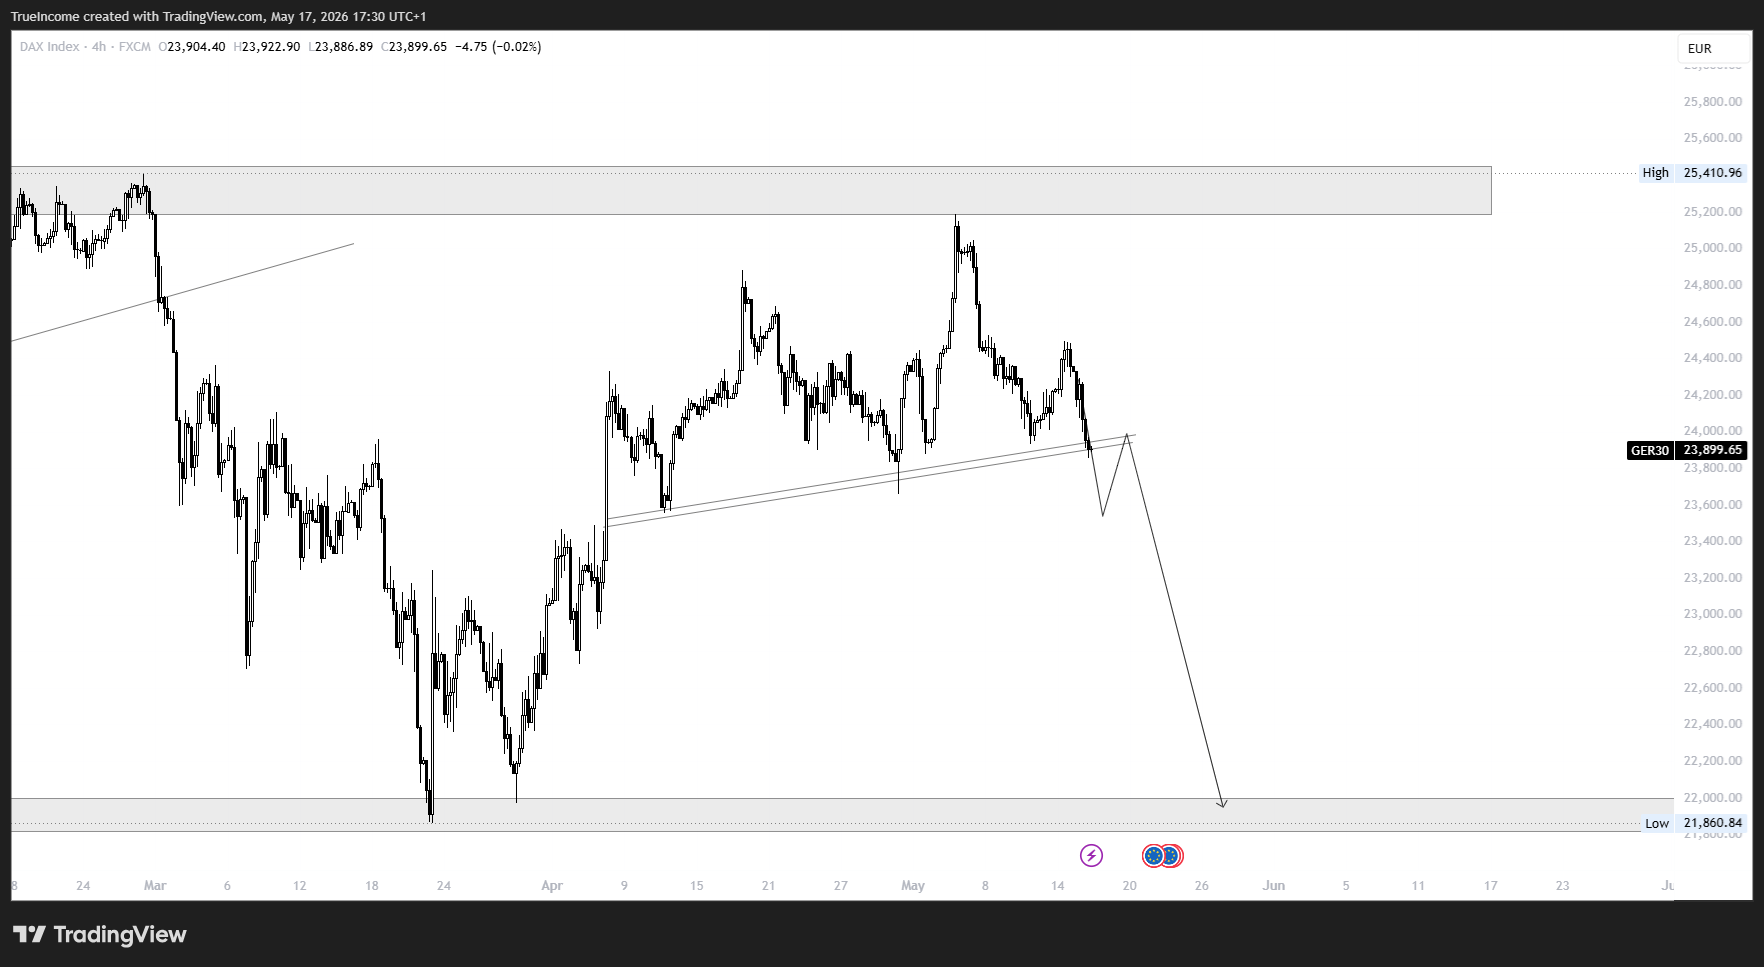
Mark the current weekly low level that needs to break. Label: "4H Range | Ascending Wedge | Key Break Level"
The Setup — What Needs to Happen
With the full multi-timeframe picture now clear, here is exactly what we are waiting for before executing this trade:
The Trigger:
A clear break and close below the current Weekly Low on the 4-hour or daily timeframe — followed by either a direct continuation or a retest of the broken level.
This is non-negotiable. We do not sell into the middle of the current range. We do not anticipate the break before it happens. We wait for the weekly low to be decisively broken — and then we act.
Why the Break Matters:
The weekly low is currently acting as the last line of defence for buyers in this zone. As long as price holds above it, buyers can still claim partial control of this area. Once that level breaks with conviction — sellers take full control, the range is resolved to the downside, and the path toward our target opens up.
A retest of the broken weekly low (price returning to the level after breaking it, finding resistance there, and turning back down) is an ideal entry point — it gives the best possible risk:reward on the trade.
📸 [INSERT 4H CHART WITH ANNOTATIONS — Mark the weekly low level clearly. Draw the two scenarios: (1) direct break and continuation lower, (2) break, retest, and continuation lower. Mark the target zone at 21,900. Label: "Break of Weekly Low | Entry on Retest | Target: 21,900"]
The Trade Plan
Entry Conditions:
- Primary Entry: 4H or Daily candle close below the current Weekly Low
- Ideal Entry: On a retest of the broken weekly low (now acting as resistance)
- Aggressive Entry: On the break candle itself with a tight stop above the broken level
Stop Loss:
- Placed above the current weekly low (broken support, now resistance)
- Or above the most recent 4H swing high within the range
- No trade should be risked without a clearly defined stop
Target:
- Primary Target: 21,900 zone — approximately 1,900 points from current levels
- This represents an 8.15% move from current price
- The target aligns with a significant historical support zone and the lower boundary of the broader macro range
Risk:Reward:
- Based on entry near 23,900 and target at 21,900 — the potential reward is approximately 2,000 points
- With a well-placed stop of 200–300 points above entry, the risk:reward on this trade is in the region of 1:6 to 1:8
- This is an exceptional risk:reward setup — the kind that appears only when weekly, daily, and intraday signals align simultaneously
The Multi-Timeframe Alignment Summary
This is what makes this setup genuinely compelling — the rare alignment of signals across three timeframes:
| Timeframe | What It Shows | Signal |
|---|---|---|
| Weekly | Rejection from all-time/multi-month high, bearish close, testing weekly lows | 🔴 Strongly Bearish |
| Daily | Reversal pattern at highs + momentum divergence | 🔴 Strongly Bearish |
| 4-Hour | Ranging near lows, ascending wedge, compression before break | 🟡 Waiting for Trigger |
When the weekly, daily, and 4-hour all point in the same direction — and the only thing missing is the execution trigger — that is when a trader prepares carefully and waits patiently.
What We Are Watching This Week
Here is the specific checklist for the coming sessions:
✅ Trigger: 4H or daily candle closes clearly below the current weekly low ✅ Confirmation: Retest of broken level showing rejection (bearish candle at the level) ✅ Entry: Short position on confirmed retest rejection ✅ Stop: Above the retest rejection candle high ✅ Target: 21,900 zone — trail stop as price moves in favour
❌ What we are NOT doing:
- Selling into the middle of the current range without a break
- Entering before the weekly low is broken
- Risking more than 1–2% of account on this setup regardless of conviction
The Bigger Picture — Why This Move Makes Sense
Beyond the pure technical signals, the broader context supports this bearish thesis.
The GER30 ran aggressively from its April lows near 21,860 all the way to the 25,199 highs — a move of over 3,300 points in just a few weeks. That kind of rapid move almost always requires a period of correction and redistribution before the next directional phase begins.
The rejection at 25,199 was not just a technical resistance — it was the market saying that the rally had moved too far, too fast. The divergence on the daily timeframe confirmed that the buying momentum behind the move was fading. And the current compression near the weekly lows confirms that the correction is not finished.
The 21,900 target is not arbitrary. It represents the lower range of the significant consolidation zone that the index spent several weeks building between February and April. Markets frequently return to test these zones after major moves — and given the weight of bearish evidence stacking up across timeframes, this target is technically well-grounded.
Risk Management — This Is Not Optional
A setup with 1:6 to 1:8 risk:reward sounds exciting. And it should. But it is important to stay grounded in proper risk management regardless of how strong a setup appears.
- Risk only 1–2% of your account on this trade
- Never add to a losing position if the break happens and immediately reverses against you
- Respect the stop loss — if price reclaims the weekly low convincingly after breaking it, the setup is invalidated
- Take partial profit at halfway (around 22,800–22,900) and move stop to break even — protect the trade as it develops
The best setups still require the best discipline.
Final Thoughts
The German 30 is setting up one of the most structurally clear bearish trade ideas we have seen in recent months. A rejection from peak resistance on the weekly. A reversal pattern and divergence on the daily. A ranging compression on the 4-hour. All three timeframes telling the same story.
Now we wait for the market to give us permission — in the form of a clean break below the weekly low — and then we execute with precision.
We will be monitoring this setup closely and sharing real-time updates in our trading community. If you want to follow this trade as it develops — including entry alerts, trade management updates, and target notifications — join our WhatsApp community below.
👉 Join Our WhatsApp Community for Live Trade Updates
👉 Join the Free 4-Week Forex Training
👉 Book a Mentorship Session
Disclaimer: This analysis is for educational purposes only and does not constitute financial advice. Index trading involves significant risk. Always conduct your own analysis and apply proper risk management before entering any trade.
About the Author James Tobi is a funded forex trader and founder of TrueIncome LTD. He shares weekly trade ideas, multi-timeframe market analysis, and educational content to help traders at every level develop a structured, disciplined approach to trading the global markets.