Quick Summary
| Detail | Info |
|---|---|
| Pair | EUR/CHF (Euro vs Swiss Franc) |
| Timeframe | 4-Hour (4H) |
| Date | May 17, 2026 |
| Current Price | 0.91464 |
| Bias | Bearish — but waiting for confirmation |
| Sell Target | ~150 pips |
| Buy Target | ~100 pips |
| Status | ⏳ Waiting — No active trade yet |
Market Context — What Is EURCHF Doing Right Now?
EURCHF has been in a clean, well-defined descending channel on the 4-hour timeframe for several weeks. A descending channel means the market is making consistently lower highs and lower lows — a classic structure that signals sellers are in control of this pair.
Within this bearish structure, price has been respecting both the upper boundary (resistance) and the lower boundary (support) of the channel with reasonable precision — creating a predictable range of movement for prepared traders.
As of today, two significant things have happened:
First — price recently rallied up and made contact with a key resistance zone near the top of the channel and at a historically significant supply area. At that level, sellers stepped in and rejected price sharply — pushing EURCHF back downward, as expected at a level of that significance.
Second — that rejection has now brought price down to a major support zone at approximately 0.9135–0.9140. This is a critical zone that has been tested and respected multiple times previously — making it an area where buyer activity is historically strong.
This is where things get interesting. And this is where patience becomes the most important tool in a trader's kit.
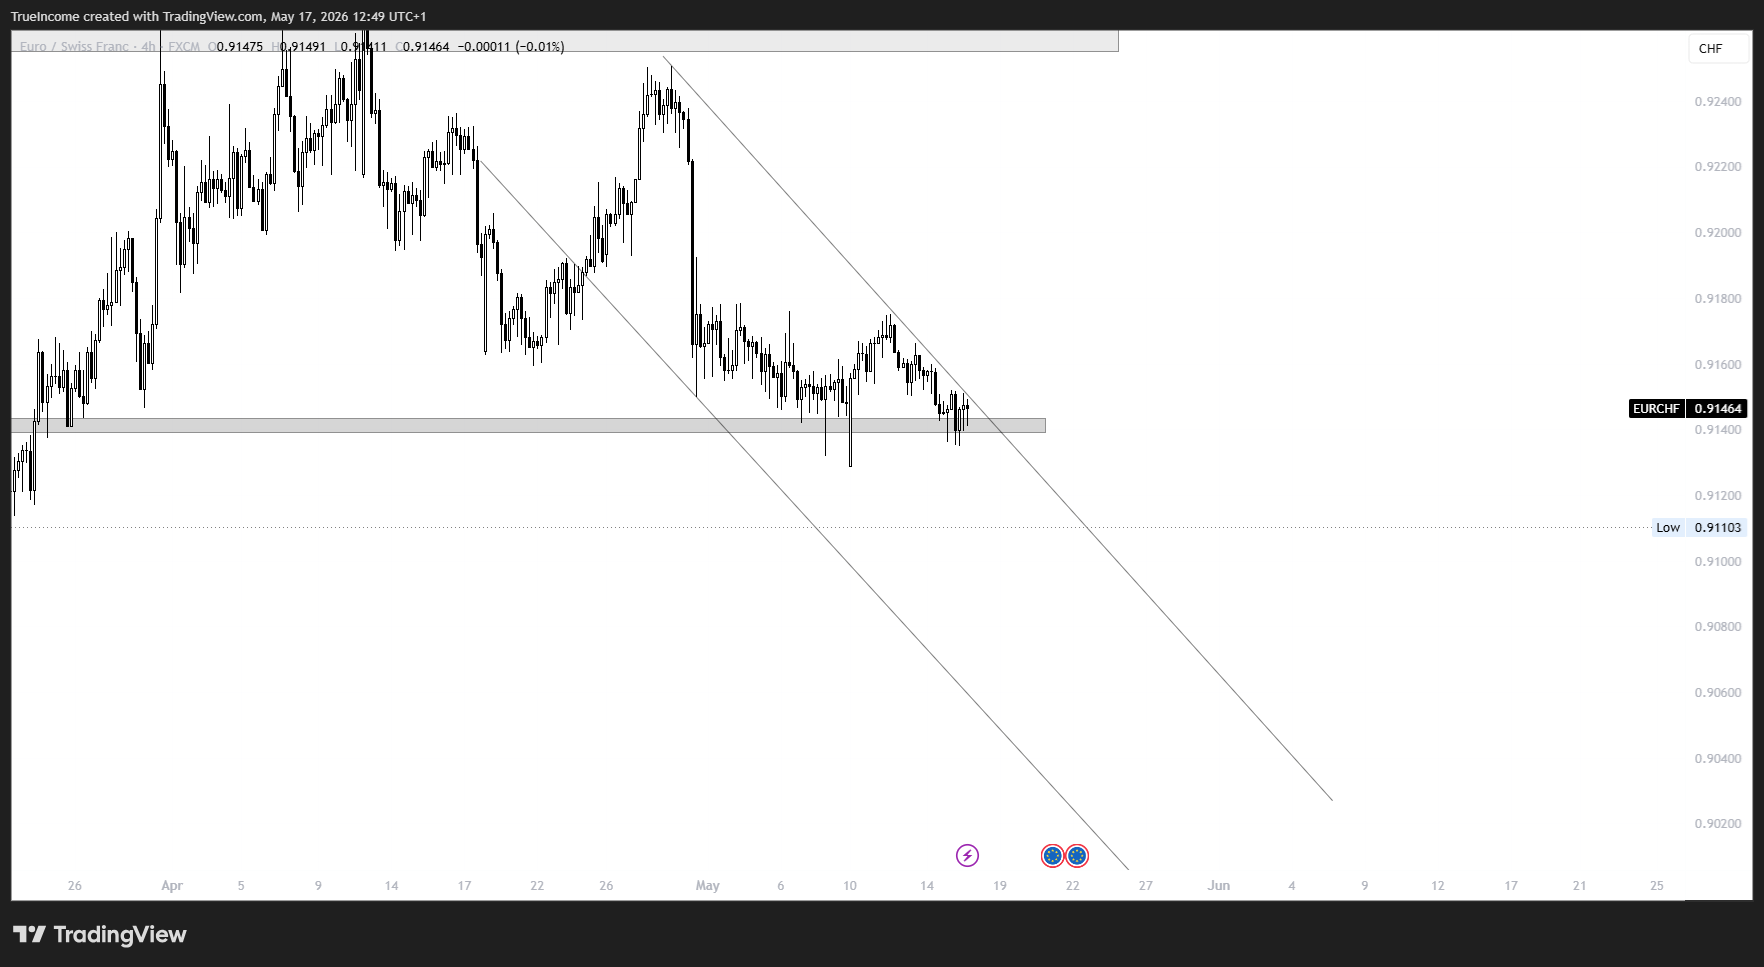
Full 4H EURCHF chart showing the descending channel, the key resistance zone at the top, and the current support zone where price is sitting.
The Setup — Two Scenarios in Play
This is not a simple one-directional trade idea. EURCHF is at a decision point — and the honest analysis right now is that two valid scenarios exist, each with their own trigger, confirmation, and target.
A disciplined trader does not force a trade at this stage. A disciplined trader defines both scenarios in advance — and waits for the market to show which path it is choosing before committing capital.
Here is exactly what we are watching:
Scenario 1 — The Sell (Bearish Continuation)
The Logic:
Price has rejected from key resistance and is now sitting at support. In a descending channel, the most likely outcome — statistically — is that price will eventually break below support and continue the downward trend.
However, the word "eventually" is doing a lot of work in that sentence. Right now, price is at a support zone. And support zones — by definition — are areas where buyers can push back. Selling directly into a support zone without confirmation is not a trade. It is a gamble.
This is the critical point most traders miss: the fact that we are bearish overall does not make a sell safe at every moment. At this exact level — sitting on a support — the risk of a temporary reversal or liquidity sweep to the upside is high. A premature sell here could easily get stopped out before the real move downward begins.
What We Need to See:
For the sell to be valid and safe, we need a clear, decisive breakout below the current support zone on the 4-hour chart. We are not looking for price to just touch below the level — we need a convincing break with momentum and a candle that closes clearly below it.
Once that breakout is confirmed:
- Entry: On the retest of the broken support (now resistance) or on the break candle itself
- Stop Loss: Above the broken support zone
- Target: Approximately 150 pips to the downside — continuing along the lower boundary of the descending channel
- Risk:Reward: Minimum 1:2
The Key Warning:
⚠️ Do not sell into the current support level without a confirmed breakdown. The support zone is active. Selling prematurely here is a low-probability trade that puts you directly in the path of potential buyer activity.
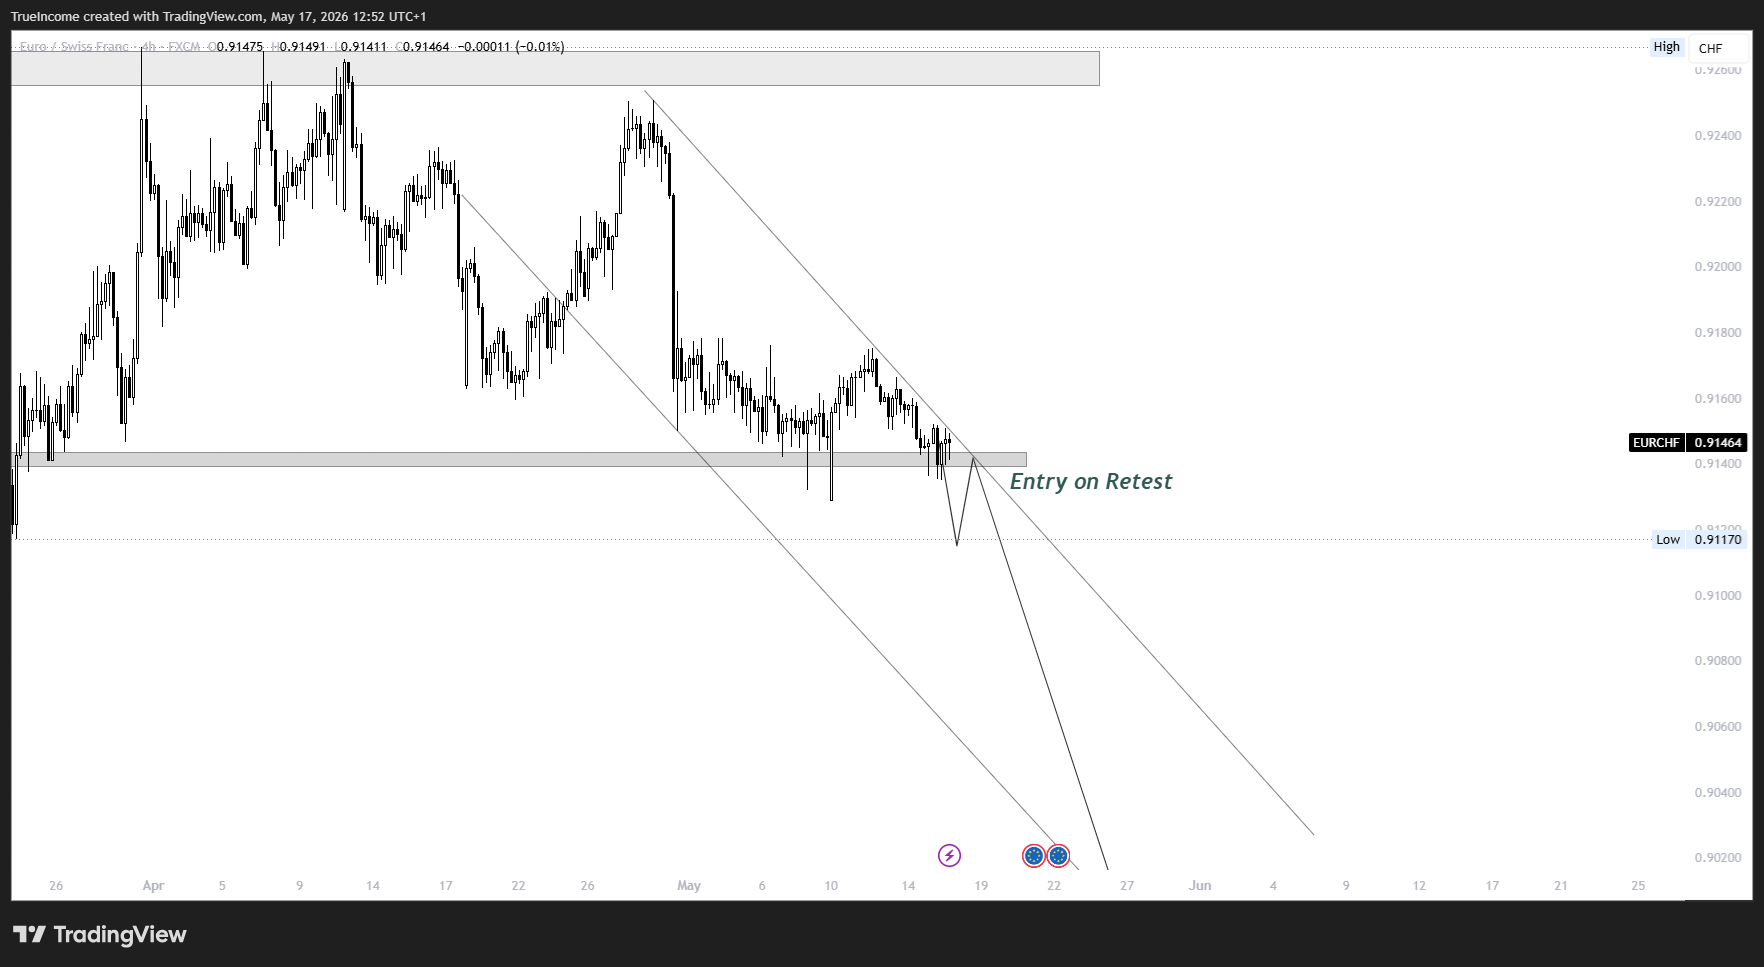
projected 150-pip sell target. Label: " | Target: ~150 Pips"]
Scenario 2 — The Buy (Bullish Rejection)
The Logic:
A descending channel is a bearish structure — but it is important to remember that within every bearish channel, there are buy opportunities. Price does not move in a straight line downward. It moves in waves — lower highs and lower lows — with temporary upward moves between each leg down.
The current support zone is exactly the kind of level where those temporary upward moves (countertrend bounces) originate from.
Beyond the immediate support zone, there is an additional scenario that would shift the entire picture: a breakout of the channel itself. If price breaks above the upper boundary of the descending channel — particularly with a strong daily candle closing above it — that would be a significant structural signal that the bearish trend is losing strength and a more substantial bullish move may be underway.
What We Need to See:
Two conditions would trigger a buy consideration:
Condition A — Support Bounce: A strong bullish rejection candle forming at the current support zone — particularly a daily candle closing convincingly above the support level — signals buyers defending the zone aggressively. This is a buy signal within the channel, targeting the upper boundary.
Condition B — Channel Breakout: A daily candle closing clearly above the upper boundary of the descending channel would signal a potential trend change. This is a more powerful buy signal — suggesting the bears are exhausted and bulls are taking control.
If either condition is met next week:
- Entry: On confirmation candle close above the support or channel boundary
- Stop Loss: Below the support zone (for Condition A) or below the channel boundary (for Condition B)
- Target: Approximately 100 pips to the upside
- Risk:Reward: Minimum 1:2
The Key Observation:
💡 The sellers who pushed price down from resistance have done significant work. But that selling pressure is exactly what builds a foundation for buyers at the support. Until the support breaks, buyers have as much right to this level as sellers.
Mark the same support zone. Draw an arrow showing the potential bounce/buy direction. Mark the channel upper boundary. Label: "Bounce Scenario | Bullish Rejection Entry | Target: ~100 Pips" and "Channel Breakout Scenario | Daily Close Above Channel | Target: ~100 Pips"]
The Decision Tree — How We Are Thinking About This
EURCHF Currently at Support Zone (0.9135–0.9140)
                        |
          ______________|_______________
          |                            |
   Price BREAKS BELOW              Price HOLDS or BREAKS ABOVE
   support zone with               support — OR breaks above
   clear momentum                  descending channel
          |                            |
    SELL CONFIRMED                BUY CONFIRMED
    Entry: Break retest           Entry: On daily candle close
    Target: ~150 pips             Target: ~100 pips
    SL: Above broken support      SL: Below support zone
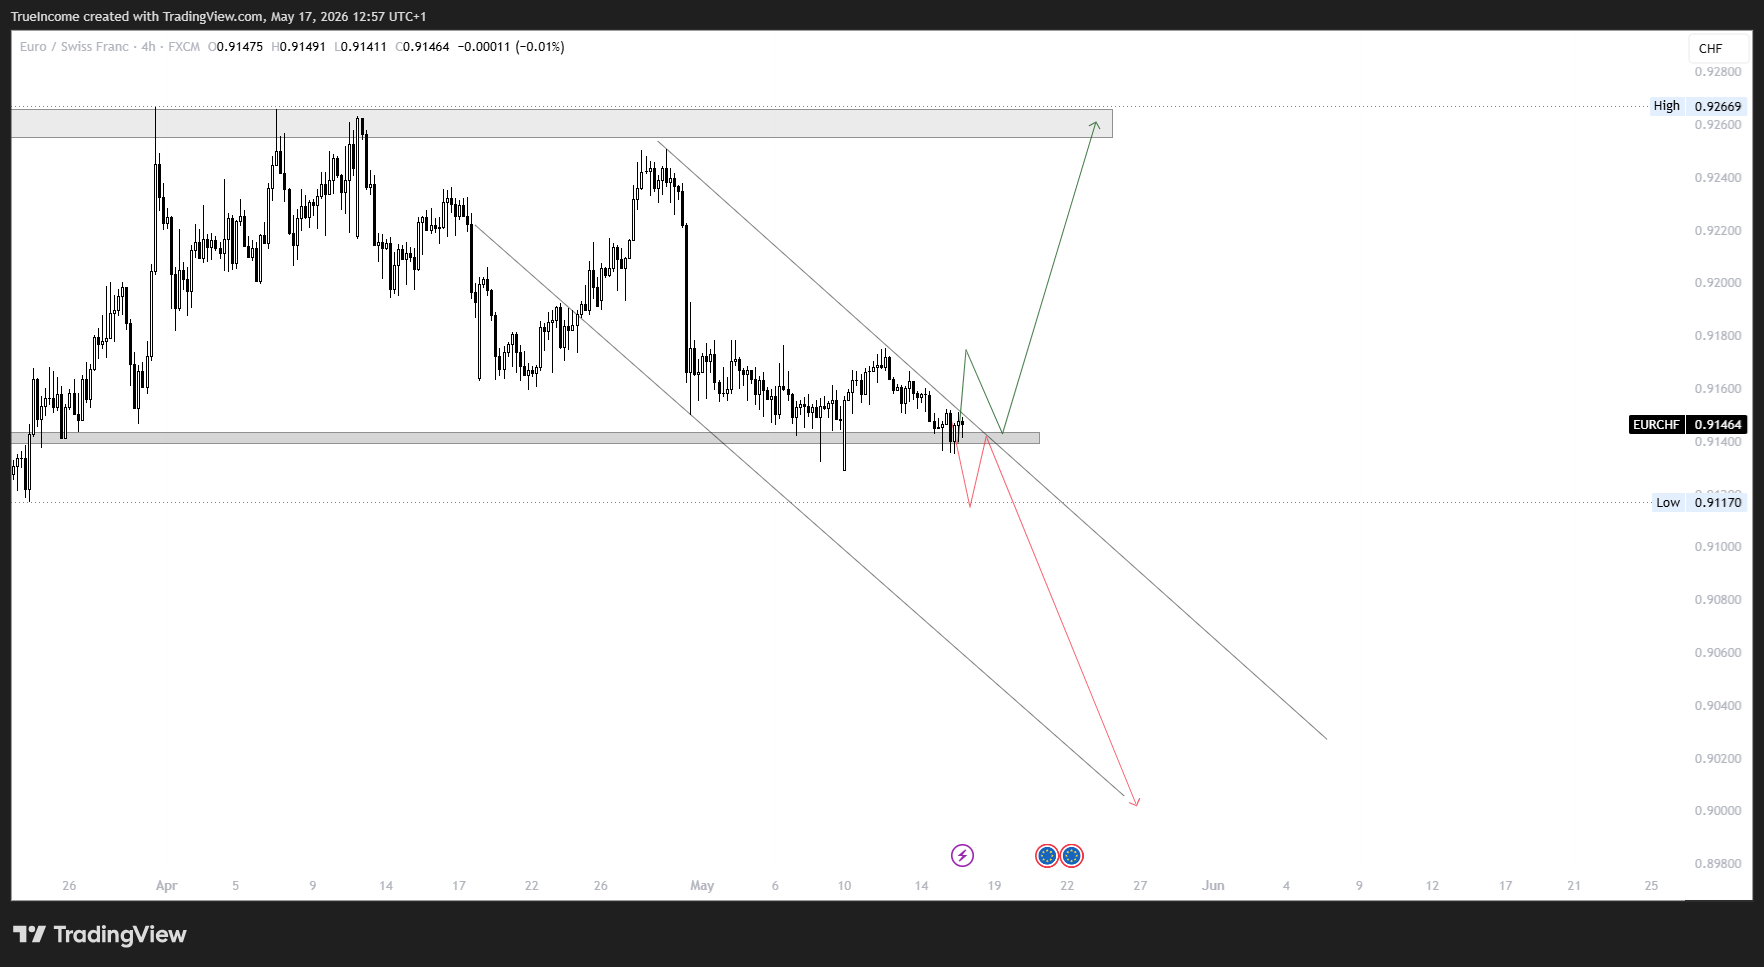
Both scenarios on the same chart with arrows for the sell path (downward) and buy path (upward). Red for sell scenario, green for buy scenario.
Why Patience Is the Real Edge Here
Let us be direct about something many retail traders struggle to accept:
The best trade right now is no trade.
EURCHF is at a crossroads. The support zone is active. The channel structure is intact. And until one of the two scenarios above plays out with clear confirmation — entering any position here is a low-probability decision dressed up as analysis.
This is one of the most important lessons in trading: knowing when not to trade is as valuable as knowing when to trade.
The market will give us a clear signal. It always does. Our job is not to predict which way it goes — our job is to wait for confirmation, then execute with precision.
Traders who enter now without confirmation are guessing. Traders who wait for the trigger are executing a plan.
What We Are Watching This Week
Here is the specific criteria we will be monitoring in the coming sessions:
✅ For the Sell: A 4H or daily candle closing clearly below the 0.9135 support zone with strong bearish momentum — followed by a retest opportunity
✅ For the Buy: A daily candle closing above the current support zone or above the upper boundary of the descending channel — showing buyers have taken control
❌ What we are NOT doing: Entering any position while price consolidates inside the support zone without a directional break
Key Levels to Mark on Your Chart
| Level | Price | Significance |
|---|---|---|
| Key Resistance | ~0.9260 | Major supply zone — price rejected here |
| Descending Channel Upper Boundary | Dynamic | Bearish channel ceiling |
| Current Support Zone | 0.9135–0.9140 | Active support — decision point |
| Sell Target | ~0.8985–0.9000 | ~150 pips from entry |
| Buy Target | ~0.9235–0.9250 | ~100 pips from entry |
Risk Management Reminder
Regardless of which scenario triggers — risk management is non-negotiable on this trade.
- Risk no more than 1–2% of your account on this setup
- Stop loss must be placed at a logical structural level — not an arbitrary pip count
- Do not move your stop loss against your trade once entered
- If the market does not give a clean confirmation trigger — this trade simply does not happen this week
Missing a trade is always better than taking a bad one.
Final Thoughts
EURCHF is setting up one of the cleaner decision-point trades we have seen in recent weeks. The structure is clear. The levels are defined. The two scenarios are mapped. All that remains is for the market to show its hand — and for us to respond with discipline rather than anticipation.
We will update this analysis as the week develops. If you want real-time trade alerts and live market commentary, join our WhatsApp trading community below — where we share setups, analysis, and trade management updates in real time.
👉 Video Analysis
👉 Join Our WhatsApp Community for Live Updates
👉 Book a Mentorship Session
Disclaimer: This analysis is for educational purposes only and does not constitute financial advice. Forex trading involves significant risk. Always conduct your own analysis and manage your risk appropriately before entering any trade.
About the Author James Tobi is a funded forex trader and founder of TrueIncome LTD. He shares weekly trade ideas, market analysis, and educational content to help traders at every level develop a structured, disciplined approach to the forex market.